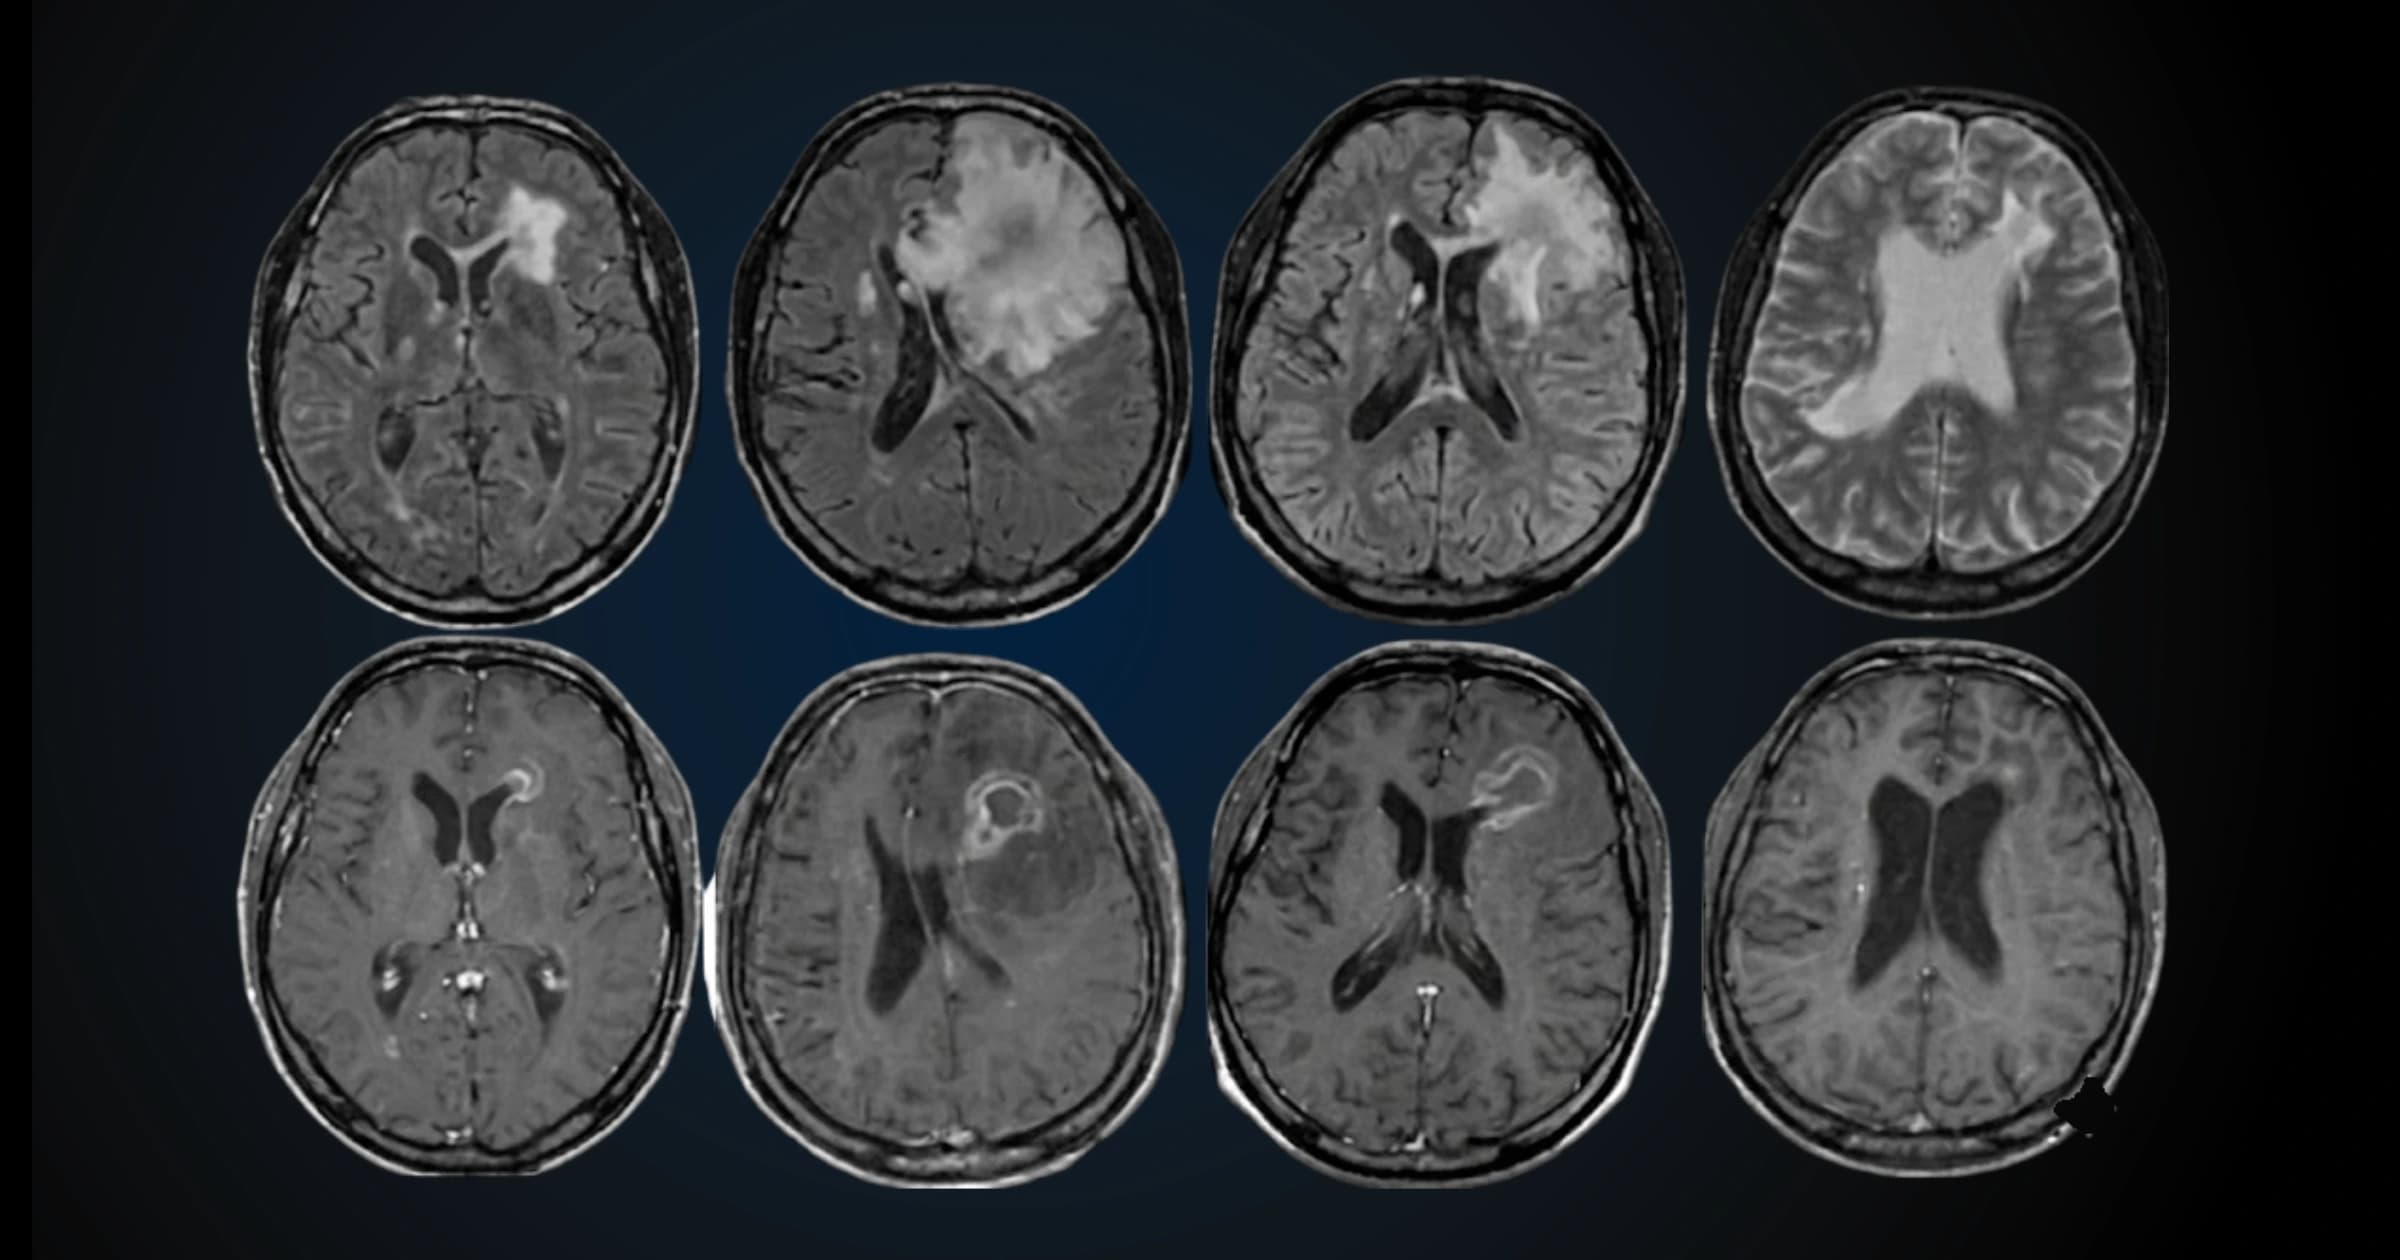
Standard MRI has always been extraordinarily powerful. It's correctly credited for cancer detection as early as stage I, when growths are visible but don't yet cause physiological symptoms. But cancer and the 500+ other conditions MRI can detect almost always need to be visible first. What about seeing things that aren't yet there, such as a trend, subtle changes, drift, and other pre-symptomatic patterns?
Interestingly, the limitation for only seeing visible change was never the scan itself, but its interpretation: biomarkers that elude the naked eye get lost when only people read the images. But that gap is closing fast for some key organs. FDA-cleared algorithms LiverMultiScan, Body Composition and NeuroQuant take the raw data already captured during an MRI scan and use complex algorithms to produce objective, trackable biomarkers that can detect disease before it becomes visible, before symptoms appear, and years before conventional diagnostics catch up.
The Liver
The liver is the body's primary metabolic engine, processing everything from alcohol to medication to dietary fat. It has almost no pain receptors as it is not equipped to process physical pain. By the time something feels wrong, the damage is often quite substantial.
Metabolic dysfunction-associated steatotic liver disease (MASLD) now affects an estimated 37.9% of US adults (1 in 4) and is projected to reach 41.4% by 2050. The vast majority are undiagnosed, because the disease is entirely asymptomatic until it advances to cirrhosis or liver failure.
Perspectum's LiverMultiScan performs multiparametric MRI analysis of the liver during a standard scan for two important metrics: the Liver Fat Fraction (PDFF) & Liver Iron Concentration (LIC). The key insight behind LiverMultiScan is that the MRI signal itself contains far more information than a radiologist can extract visually. Its algorithms convert that signal into objective, numeric values that can be tracked over time, compared to population norms, and used to flag subclinical disease.
| Biomarker | What it measures | Why it matters |
|---|---|---|
| Liver Fat Fraction (PDFF) | Proportion of MRI signal from fat vs. water in liver tissue | The best marker of early MASLD; highly accurate and reproducible across scanners |
| Liver Iron Concentration (LIC) | Systemic iron overload stored in the liver | Flags hemochromatosis and chronic liver disease; MRI now the preferred non-invasive method |
Liver Fat Fraction (PDFF)
Proton Density Fat Fraction, or PDFF, is widely considered the gold standard for non-invasive measurement of liver steatosis. The accumulation of fat in liver cells is the hallmark of early MASLD.
Unlike blood tests or ultrasound, which estimate fat indirectly, PDFF directly measures the proportion of the MRI signal coming from fat versus water in the liver tissue. This makes it both highly accurate and highly reproducible across scanner types and scan sessions, critical for longitudinal monitoring.
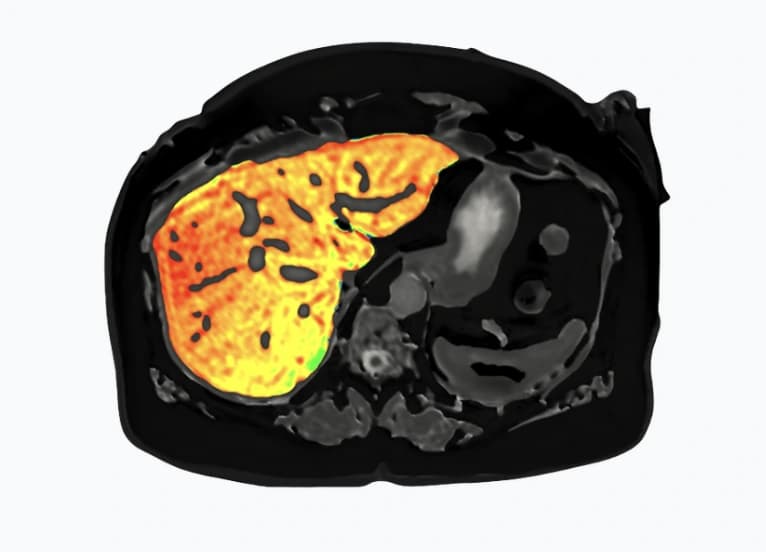
LiverMultiScan analysis visualization. Via Perspectum
Liver Iron Concentration
The human body has no mechanism to actively excrete excess iron. What accumulates, stays. Liver iron concentration (LIC) is a direct measure of systemic iron overload. As the body's primary iron storage organ, the liver is the first place iron accumulates beyond normal levels.
Elevated LIC is a marker of hereditary hemochromatosis, a condition affecting roughly 1 in 200 people of Northern European descent, as well as secondary iron overload conditions and chronic liver disease. When iron is in excess, it deposits in the liver, heart, pancreas, and endocrine glands in its toxic free radical form, leading to cell death and fibrosis, and eventually to cirrhosis and heart failure.
MRI is now the preferred non-invasive method for quantifying LIC, validated against biopsy as the reference standard. A population-level study found that 36.5% of subjects had iron concentrations high enough to require correction: that's more than one-third of all people.
The Body
Body Composition analysis of MRI data goes beyond what a scale, BMI calculation, or even a standard DEXA scan can offer. The scan separately quantifies:
| Measurement | What it is | Clinical significance |
|---|---|---|
| Visceral Adipose Tissue (VAT) | Deep abdominal fat wrapping around organs | Independent predictor of cardiovascular disease, type 2 diabetes, and all-cause mortality |
| Subcutaneous Adipose Tissue (SAT) | Fat stored just beneath the skin | Largely benign metabolic phenotype; a high VAT-to-SAT ratio is the meaningful risk signal |
| Lean tissue & skeletal muscle volume/index | Metabolically active muscle mass | Tracks preservation or loss of the tissue that drives long-term metabolic health |
VAT is an independent predictor of cardiovascular disease, type 2 diabetes, and all-cause mortality. A 30-year body of epidemiological research from the International Atherosclerosis Society confirms that visceral adiposity, accurately measured by MRI or CT, is an independent risk marker of cardiovascular and metabolic morbidity and mortality. Elevated VAT is associated with insulin resistance, lower HDL cholesterol, higher triglycerides, smaller LDL particle size, and elevated inflammatory markers including C-reactive protein.
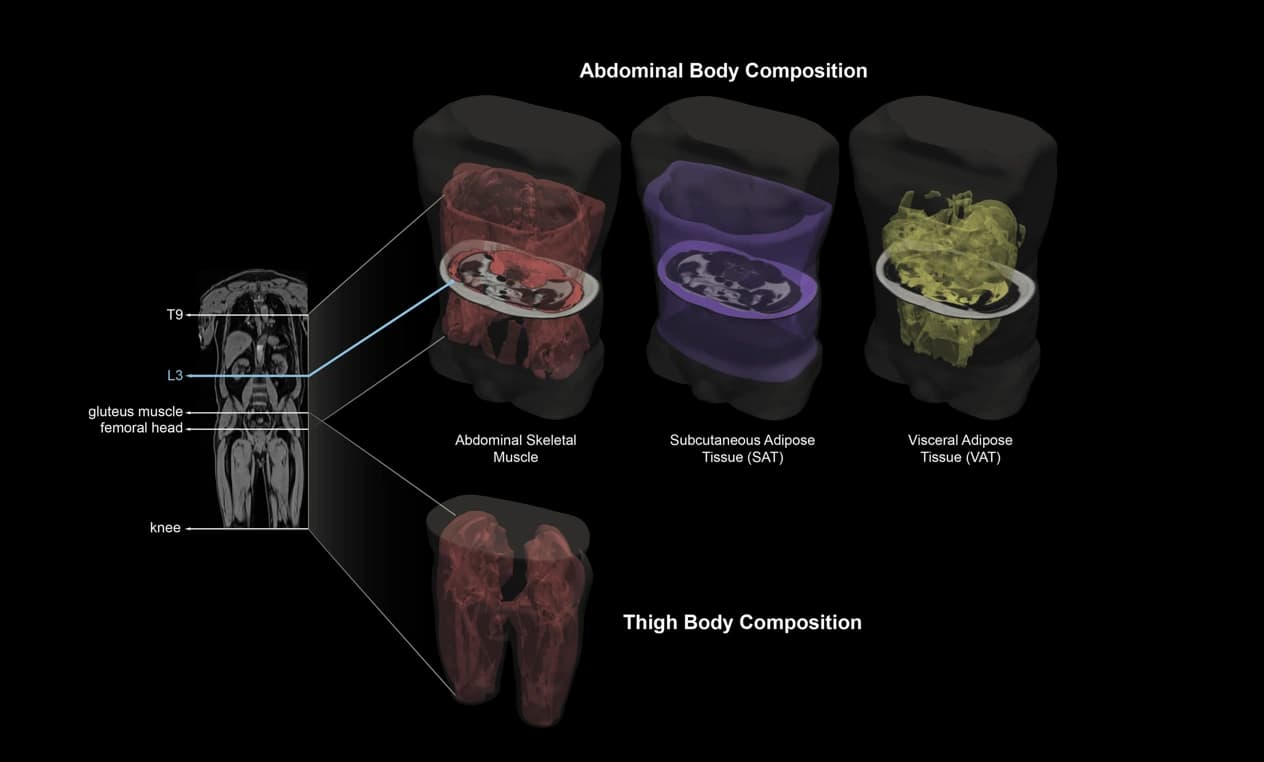
Body Composition scan component breakdown. Via Perspectum
SAT is the exact opposite. Subcutaneous fat demonstrates a largely benign metabolic phenotype, with no independent association with dyslipidemia, insulin resistance, or atherosclerosis in obese individuals. A high VAT-to-SAT ratio as opposed to high body weight alone is a meaningful cardiovascular risk signal.
A 2025 study published in Circulation found that a 10% reduction in visceral fat during an 18-month dietary intervention predicted durable improvements in insulin sensitivity and cardiometabolic markers, independent of total weight lost.
Fact Box: Why This Matters for GLP-1 Users Especially
GLP-1 receptor agonists have transformed weight loss medicine. But a critical nuance of GLP-1 treatment is that it produces both fat and lean mass loss, of which the ratio matters profoundly for long-term health. In the STEP-1 trial DXA substudy, approximately 34% of total weight lost on semaglutide 2.4mg came from lean mass.
MRI body composition analysis offers a precise before-and-after of exactly what was lost and what was preserved. The scan differentiates VAT reduction (the beneficial, cardiovascular-risk-reducing change) from lean tissue loss (the muscle preservation challenge that determines functional outcomes).
Tracking skeletal muscle index longitudinally also provides an objective measure of whether a GLP-1 treatment protocol is preserving or depleting the metabolically active tissue that drives long-term metabolic health.
The Brain
Some of the most important changes that happen in Alzheimer's disease begin 10-20 years before the first symptom appears. The hippocampus (the seahorse-shaped structure responsible for forming new memories) shrinks at approximately 1% per year in a healthy brain. In an Alzheimer's patient, that rate accelerates to approximately 5% per year.
What may trouble genetic carriers of dementia is that the difference is not detectable by conversation, cognitive screening, or even standard visual radiological review. It requires precise volumetric measurement. That is what NeuroQuant provides.
NeuroQuant is able to segment and measure the volumes of subcortical brain structures from a standard MRI scan. The measurements are compared against a normative database built from over 16,400 MRI scans of cognitively normal individuals aged from 3 to 100, with near-equal gender distribution.
The normative database uses the Lambda-Mu-Sigma (LMS) statistical method to model the non-linear relationship between age and brain volume, capturing the full arc of the lifespan, from pediatric development through late-life atrophy. The result is a percentile report: where does your hippocampus sit relative to healthy people of your exact age and sex?
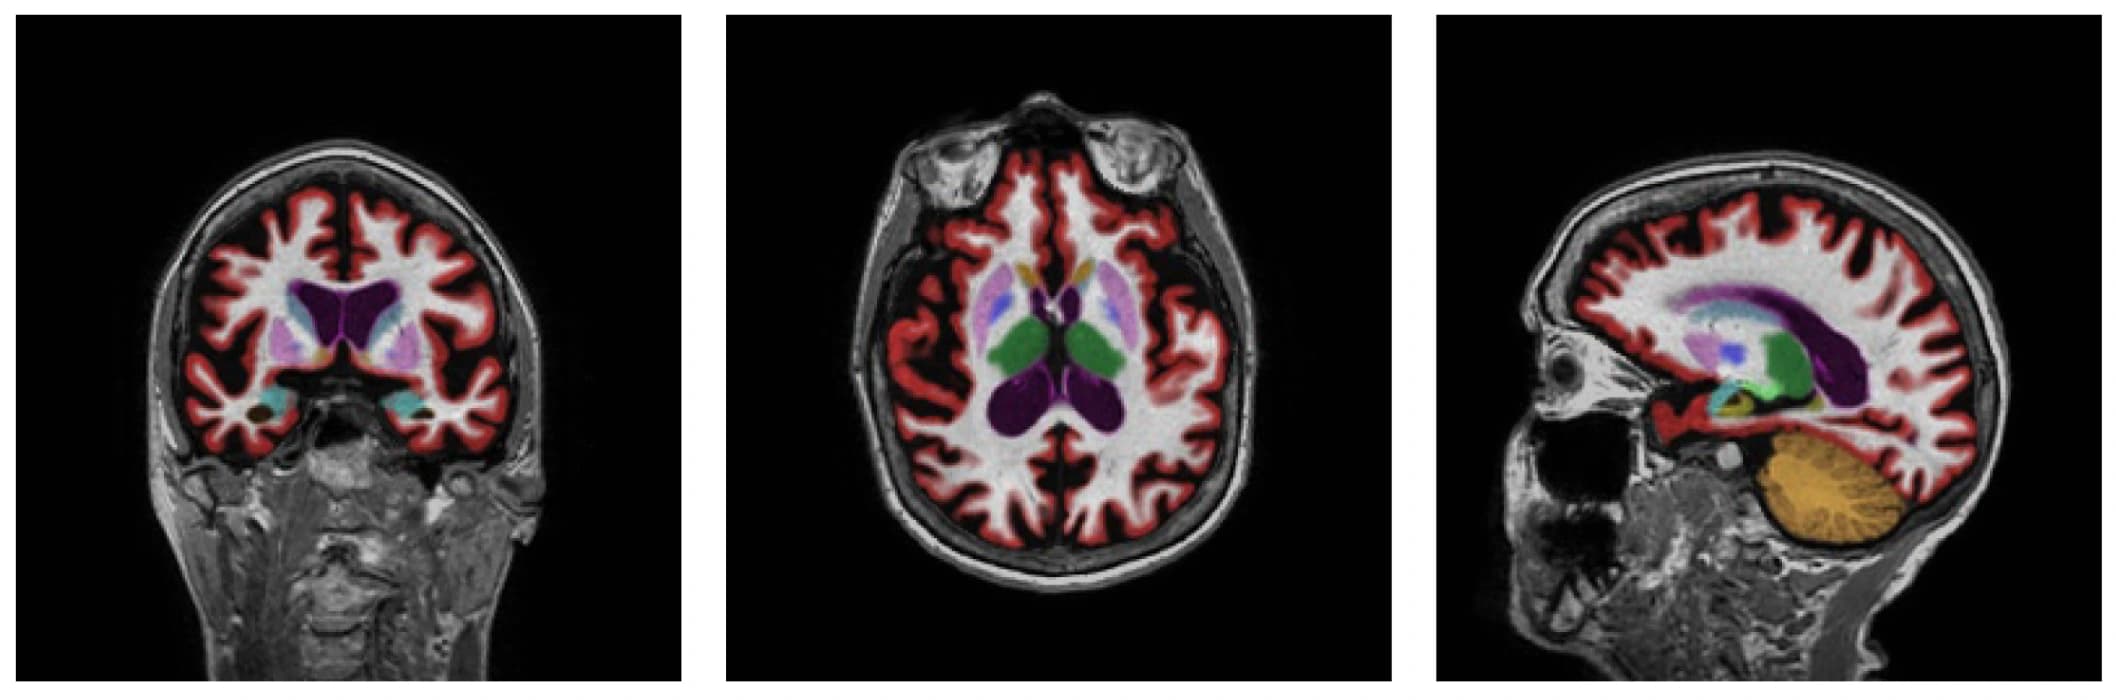
NeuroQuant image analysis in sample report. Via Cortechs.AI
A 2025 study published in Brain and Behavior evaluated 366 patients across categories of subjective cognitive decline, mild cognitive impairment (MCI), and dementia. Isolated NeuroQuant evaluation reached an area under the curve (AUC) of 0.85 for distinguishing dementia from subjective cognitive decline, significantly outperforming visual assessment alone (AUC 0.76-0.79), and was the only method capable of distinguishing Alzheimer's disease from non-Alzheimer's dementia etiologies.
Critically, in chronic traumatic brain injury patients, NeuroQuant identified atrophy or asymmetry in over 90% of cases, compared to just 12% detected by standard radiological visual assessment.
Longitudinal Tracking: The Power of Repeat Scans
A single NeuroQuant scan tells you where you are. A second scan, a year or two later, tells you whether you are aging normally or faster than expected. For neurodegenerative diseases, longitudinal tracking is how early intervention becomes possible.
TrueScan Executive MRI Scan Available in July 2026
TrueScan's Executive MRI brings Perspectum's LiverMultiScan, Body Composition, and NeuroQuant together in a single MRI session, on top of the base Full-Body MRI. In one non-invasive appointment, you walk away with objective data on:
| Component | What you receive |
|---|---|
| Perspectum MultiLiverScan | Liver fat fraction (PDFF) — the gold-standard measure of hepatic steatosis, quantified before any symptom appears Liver iron concentration — a measure of systemic iron overload the body cannot clear on its own |
| Perspectum Body Composition | Body composition breakdown — visceral adipose tissue, subcutaneous adipose tissue, lean tissue volume, and skeletal muscle volume and index |
| NeuroQuant | Hippocampal and ventricular volumes compared to your age- and sex-matched peers Multi-structure brain atrophy profile across cortical gray matter, white matter, thalamus, and subcortical regions Hippocampal volume asymmetry — an early structural marker of Alzheimer's-pattern change |
| TrueScan Full-Body Scan | Detection of over 500 different conditions in your head, neck, chest, abdomen, pelvis, and legs including:
|
Longitudinal comparison between scan sessions is also where the clinical value compounds. The first scan establishes your baseline. Every scan after it tells you how you are tracking within the normal aging curve, both in the liver or in the brain, with the kind of quantitative precision that makes early intervention actually early.
Citations
[1] Ginès P, Serra-Burriel M, Kamath PS. Metabolic Dysfunction–Associated Steatotic Liver Disease—The New Epidemic of Chronic Liver Disease. JAMA Netw Open. 2025;8(6):e2516381. link
[2] Tang, A., Tan, J., Sun, M., Hamilton, G., Bydder, M., Wolfson, T., Gamst, A. C., Middleton, M., Brunt, E. M., Loomba, R., Lavine, J. E., Schwimmer, J. B., & Sirlin, C. B. (2013). Nonalcoholic fatty liver disease: MR imaging of liver proton density fat fraction to assess hepatic steatosis. Radiology, 267(2), 422–431. link
[3] Zhang, YX., Feng, YP., You, CL. et al. The diagnostic value of MRI-PDFF in hepatic steatosis of patients with metabolic dysfunction-associated steatotic liver disease: a systematic review and meta-analysis. BMC Gastroenterol 25, 451 (2025). link
[4] Pavlides, M., Banerjee, R., Tunnicliffe, E.M., Kelly, C., Collier, J., Wang, L.M., Fleming, K.A., Cobbold, J.F., Robson, M.D., Neubauer, S. and Barnes, E. (2017), Multiparametric magnetic resonance imaging for the assessment of non-alcoholic fatty liver disease severity. Liver Int, 37: 1065–1073. link
[5] McDonald, N., Eddowes, P.J., Hodson, J. et al. Multiparametric magnetic resonance imaging for quantitation of liver disease: a two-centre cross-sectional observational study. Sci Rep 8, 9189 (2018). link
[6] Neeland I, Ross R, Després J et al. Visceral and ectopic fat, atherosclerosis, and cardiometabolic disease: a position statement. The Lancet Diabetes & Endocrinology, 2019; 7, 715–725.
[7] Jayedi, A., Dehghan, A., Soltani, S., Khan, T. A., Zhang, X., Aune, D., & Shab-Bidar, S. (2024). The association between the visceral to subcutaneous abdominal fat ratio and the risk of cardiovascular diseases: A systematic review. BMC Public Health, 24, 1860. link
[8] Klein, H., Alufer, L., Goldberg Toren, D. T., Pachter, D., Kamer, O., Ebstein Karamani, N., et al. (2026). Lifestyle-induced visceral fat loss as a key target for durable cardiometabolic health: MRI-assessed 5- and 10-year follow-up after 2 clinical trials. Circulation. Advance online publication. link
[9] Persson, K., Rhodius-Meester, H. F. M., Edwin, T. H., Knapskog, A.-B., Bekkhus-Wetterberg, P., Selbæk, G., Engedal, K., & Schellhorn, T. (2025). Automatic MRI volumetry assisted visual assessment of the medial temporal lobe in clinical dementia work-up. Brain and Behavior, 15(10), e70948. link
[10] International Brain Injury Association. (2022). NeuroQuant: Sessions for the 2022 Medical and Legal Conference. link
[11] Petralia, G., Zugni, F., Summers, P.E. et al. Whole-body magnetic resonance imaging (WB-MRI) for cancer screening: recommendations for use. Radiol med 126, 1434–1450 (2021). link
[12] Institute for Quality and Efficiency in Health Care (IQWiG). (2016, August 22). In brief: How does the liver work? InformedHealth.org. link
[13] Alustiza, J. M., Castiella, A., Zapata, E., Urreta, I., Salvador, E. & Emparanza, J. I. (2023). Non-invasive measurement of liver iron concentration by magnetic resonance imaging and its clinical usefulness. Archives of Medical Science, 19(3), 784–791. link
[14] Baddam, S., & Chen, R. J. (2025, July 7). Iron overload and toxicity. In StatPearls [Internet]. StatPearls Publishing. link
[15] Mocciaro G, Capodici A, De Amicis R. GLP-1 receptor agonists induce loss of lean mass: so does caloric restriction. BMJ Nutrition, Prevention & Health. 2025;8. link
[16] CorTechs Laboratories. (n.d.). NeuroQuant: Automated brain MRI analysis. link
[17] CorTechs Laboratories. (n.d.). Clinical performance of NeuroQuant: Transforming brain MRI analysis. link