For years, heart scans have focused on calcium scores which measures hardened plaque build-up in your arteries. While this is a key factor in predicting heart attacks, it is vastly incomplete. Calcium scoring only shows calcified plaque, not the softer, more volatile plaque that ruptures easily causing sudden, unexpected heart attacks. In fact, studies show that soft plaque carries a 22.7% three-year event rate compared to just 5.5% for calcified plaque alone.
At TrueScan, we're offering something game-changing: Coronary CT Angiography (CCTA) combined with HeartFlow's AI analysis. This lets us see not just whether arteries are narrowed, but what kind of plaque is there and how it is affecting blood flow in real time, insight crucial to optimizing heart attack prevention and risk mitigation.
What Is HeartFlow AI, in Plain English?
A CCTA is a specialized CT scan of your heart's arteries. We inject contrast dye and capture images between heartbeats to create a detailed 3D map of your coronary vessels.
HeartFlow AI takes these images and performs two powerful, FDA-cleared analyses:
- Plaque Analysis measures how much plaque you have in each artery, what type it is (calcified, soft, and low attenuation plaque), and how your total plaque burden compares to others your age.
- FFRct (Fractional Flow Reserve CT) simulates blood flow through your arteries to show where flow is normal, borderline, or significantly reduced, without an invasive catheter procedure.
In practical terms, CCTA shows us the pipes, but HeartFlow shows us the plumbing (what type of pipes and how well blood is actually getting through).
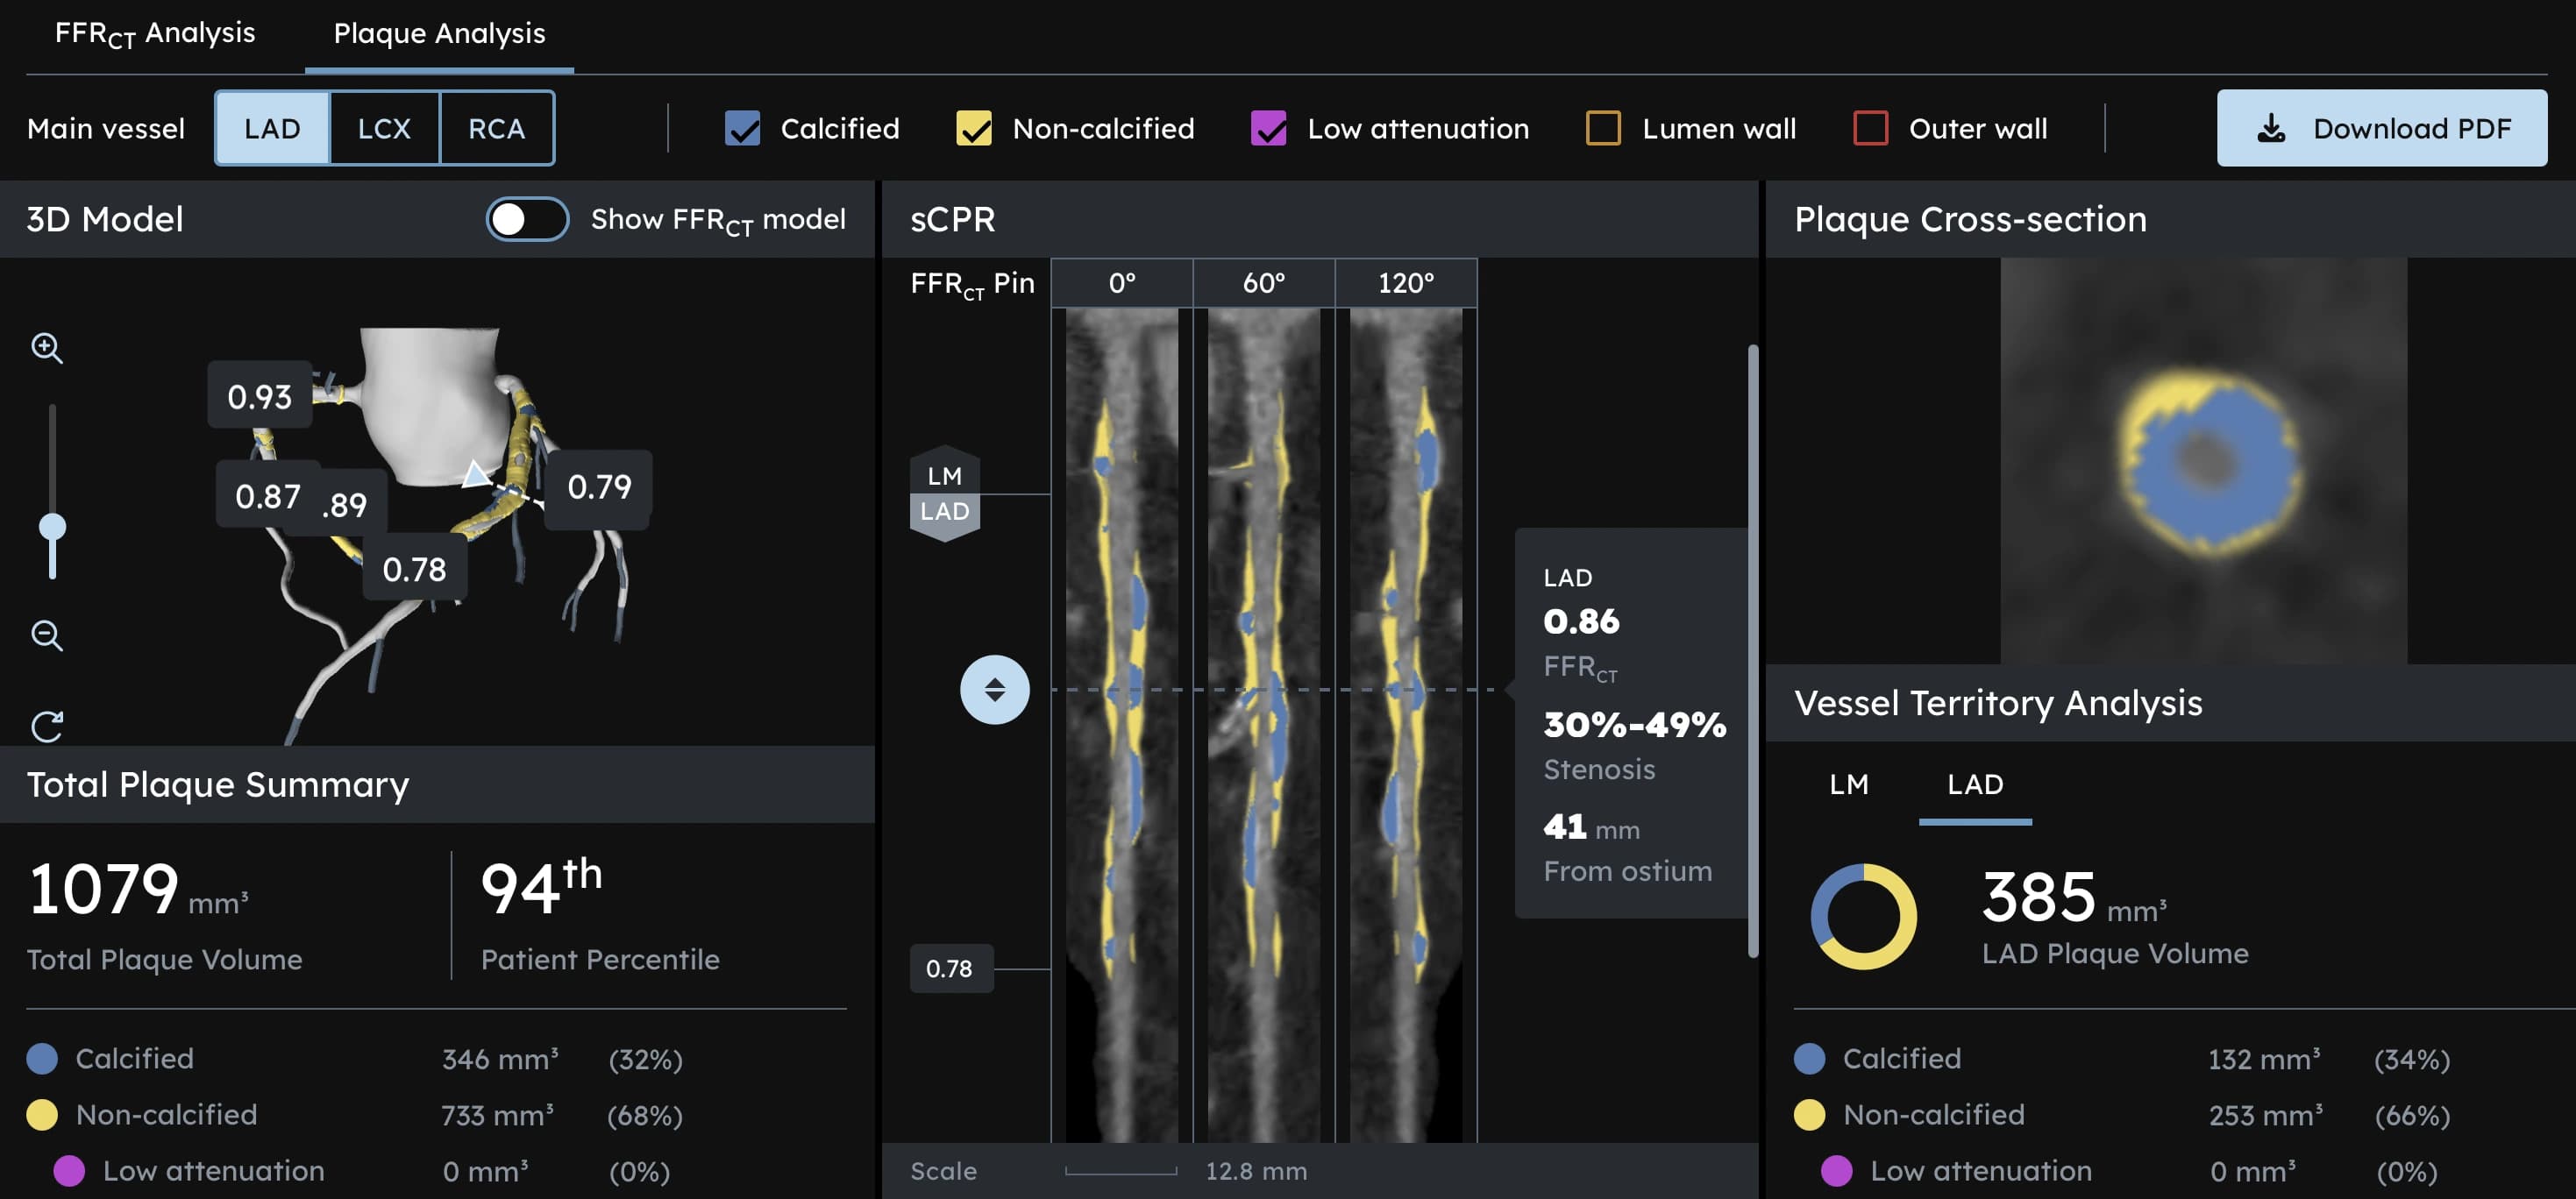
On the HeartFlow dashboard, we see:
- A 3D reconstruction of your three main coronary arteries (Left Anterior Descending, Left Circumflex, and Right Coronary Artery)
- Cross-section slices that show vessel walls and plaque composition at every point
- Color-coded segments indicating calcified plaque (blue), soft plaque (yellow), and low-attenuation plaque (red, the most dangerous type)
- A comprehensive summary of total plaque volume (measured in mm³), composition percentages, and percentile ranking compared to your age group
This combination, plaque type plus flow, helps cardiologists understand not just whether a vessel is narrowed, but whether it is truly limiting blood supply and increasing short-term risk.
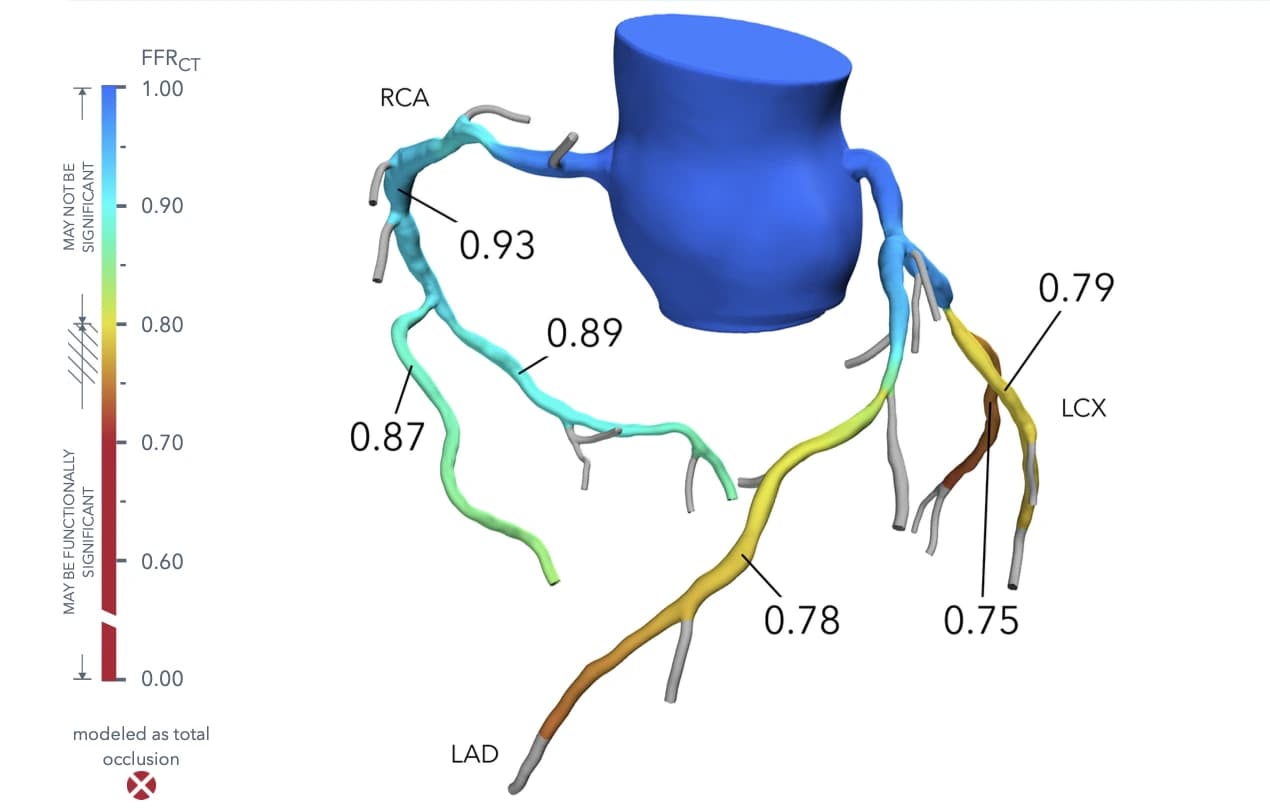
Exhibit 1. FFRct view with color-coded blood flow (green = normal flow, yellow/orange = borderline, red = significantly reduced). Values above about 0.80 usually indicate normal flow, 0.75–0.80 is borderline, and below 0.75 suggests significantly reduced flow, where intervention might improve outcomes. Image courtesy of TrueScan St. Petersburg.
Understanding Your Three Coronary Arteries
Your heart relies on three main coronary arteries to deliver oxygen-rich blood:
Left Anterior Descending (LAD): Often called the "widow-maker," this artery supplies the front wall and most of your left ventricle (the heart's main pumping chamber). A complete blockage here is often fatal without immediate intervention.
Left Circumflex (LCx): Wraps around the side and back of your heart, supplying the lateral and posterior walls of the left ventricle. Blockages here can be subtle but dangerous.
Right Coronary Artery (RCA): Supplies the right side of your heart and portions of the left ventricle. Also feeds the heart's electrical system, so blockages can cause rhythm problems.
HeartFlow analyzes each artery individually, showing you exactly where plaque has accumulated and how it's affecting blood flow in each critical vessel.
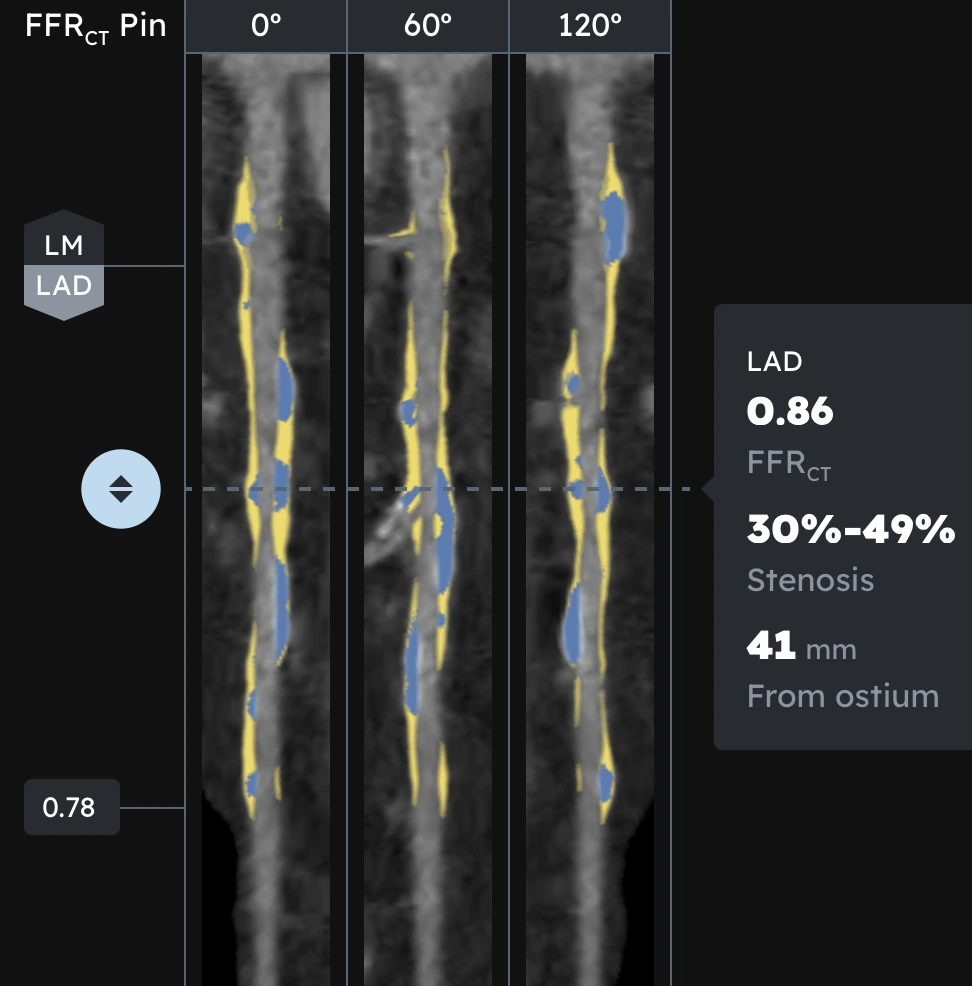
Exhibit 2. Imaging of the Left Anterior Descending (LAD) artery, a critical coronary vessel supplying blood to the front of the heart's left ventricle. Often called the "widow-maker," a full blockage here is highly fatal, necessitating immediate, emergency care. Image courtesy of TrueScan St. Petersburg.
Plaque 101: The Difference Between Calcified and Soft Plaque
Plaque is the buildup of cholesterol, fats, inflammatory cells, and calcium in the artery wall, a process called atherosclerosis.
Broadly, there are two key types we care about:
- Calcified plaque (hard plaque): More stable, made largely of calcium. It tends to grow slowly over years and is less likely to rupture. (Shown in diagrams in blue)
- Non-calcified "soft" plaque: Richer in lipids (fats) and inflammatory cells, more unstable, and more likely to rupture into the bloodstream and cause a clot. This includes:
- Fibrous plaque (moderately dense)
- Fibro-fatty plaque (mix of fibrous and fatty tissue)
- Low-attenuation plaque (LAP): the most dangerous type, appearing nearly black on imaging due to its lipid-rich, necrotic core
Why Soft Plaque Is So Dangerous
Soft plaque is particularly important because rupture of this kind of plaque is responsible for the majority of sudden heart attacks, often in people who had few or no symptoms.
The data is striking:
- Low-attenuation plaque (LAP) >4% of total plaque volume carries a 4.65 times higher risk of major adverse cardiac events
- Patients with soft plaque have a 22.7% three-year event rate compared to 5.5% for those with primarily calcified plaque
- Approximately 50% of heart attacks occur in people with no prior symptoms
Many studies show that specific high-risk features on CCTA, especially low-attenuation (very lipid-rich) plaque, are strongly associated with future major cardiac events.
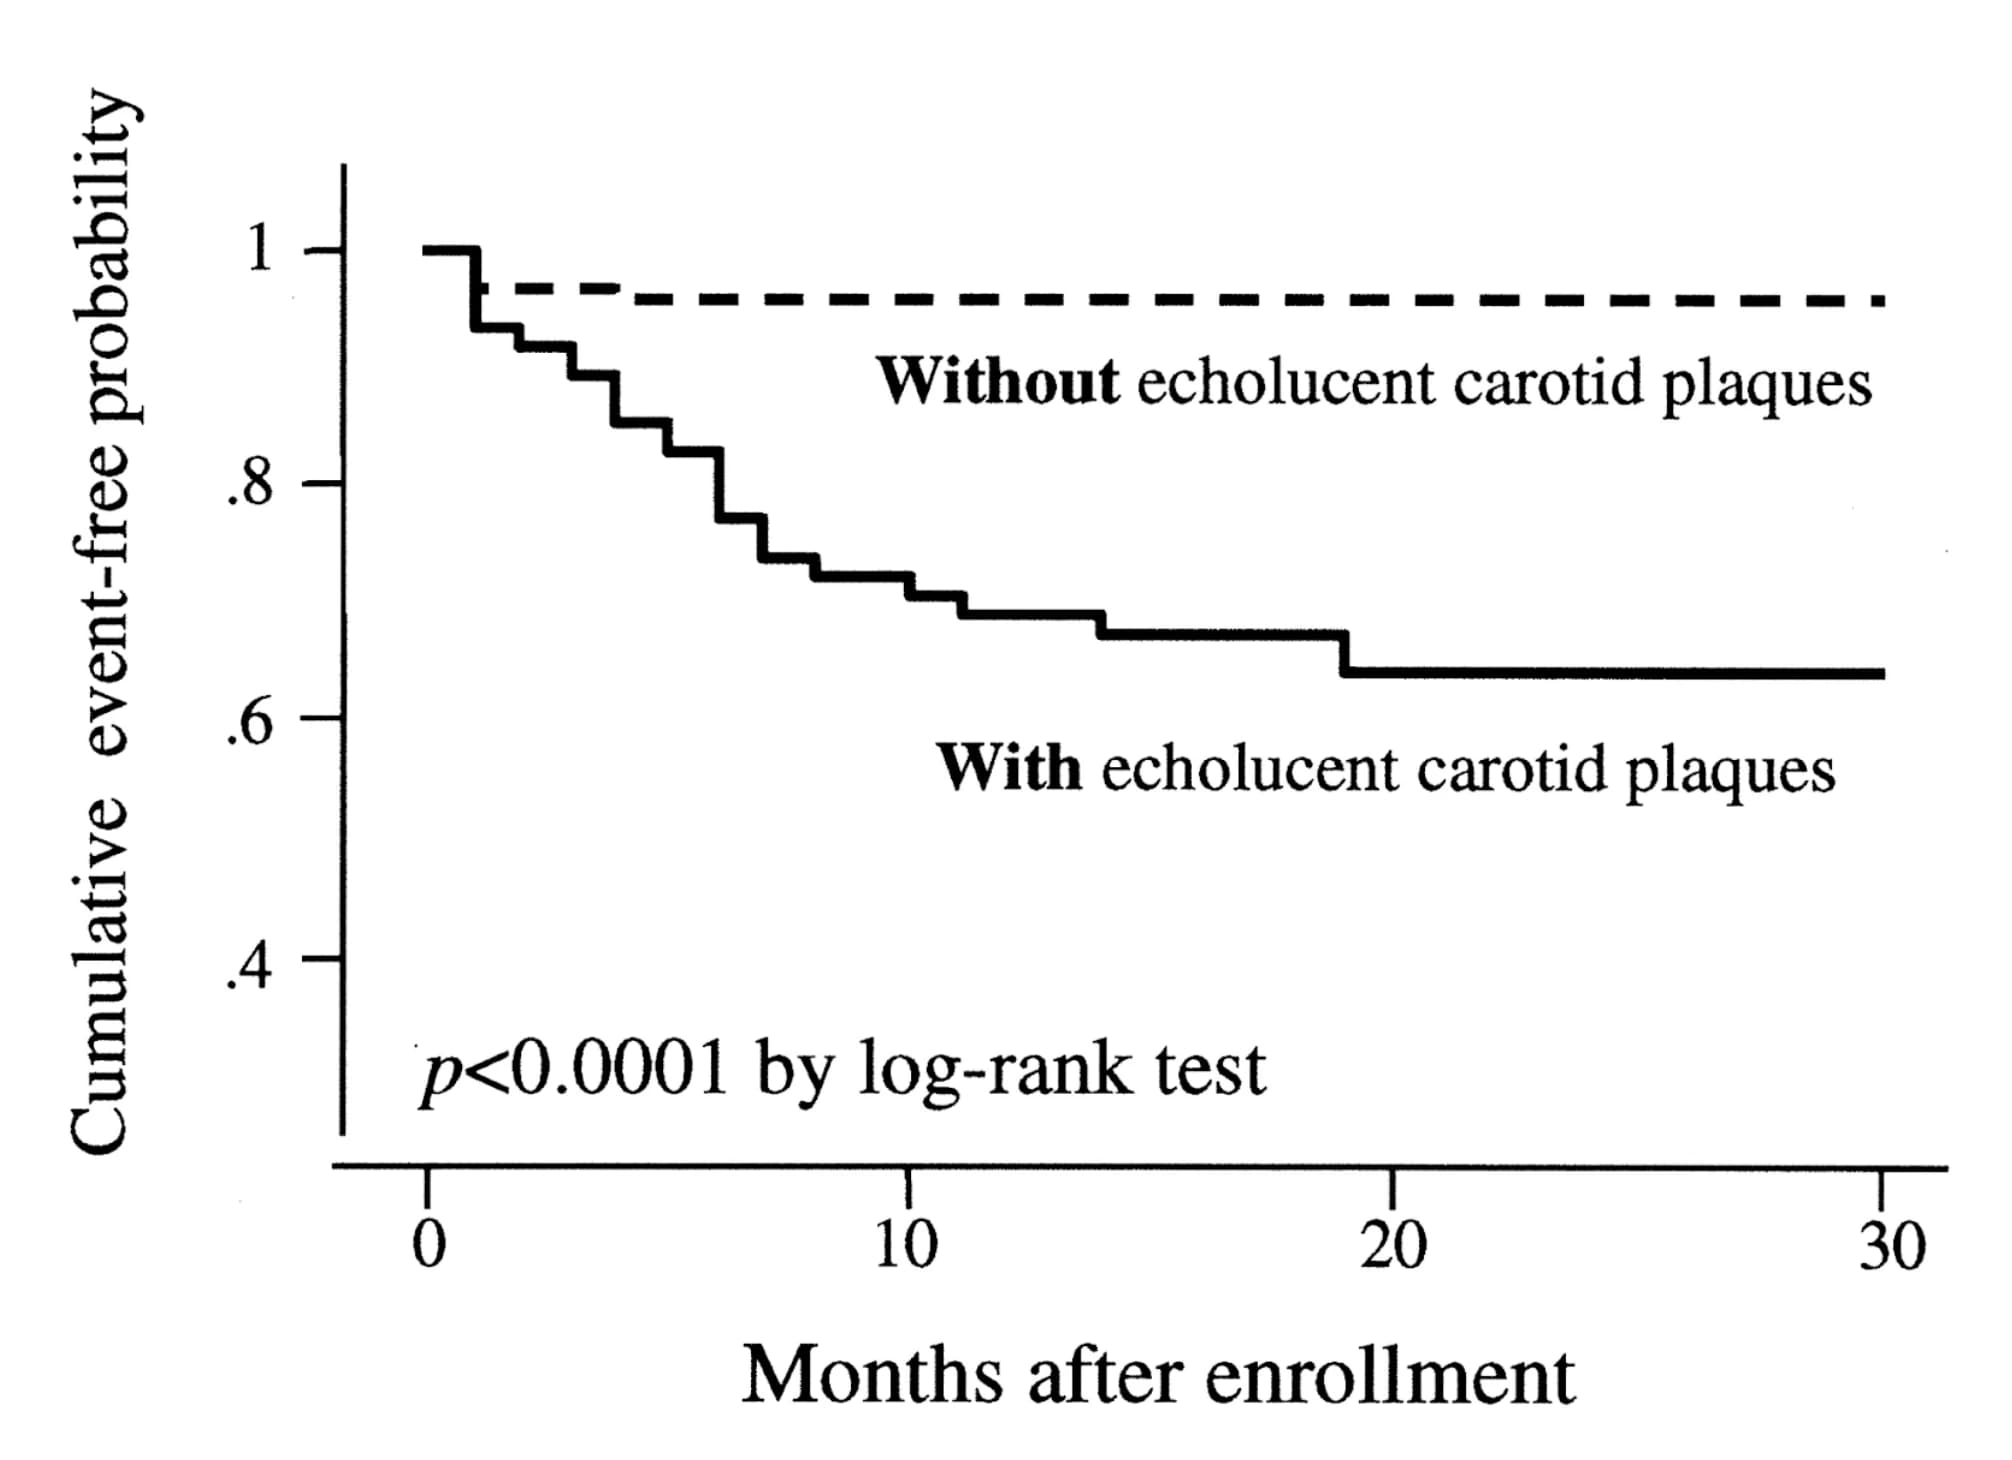
Exhibit 3. Kaplan-Meier curves comparing the probability of a heart attack during a follow-up period of 2–3 years in 215 patients with stable coronary artery disease, grouped by the presence or absence of soft plaques. The cumulative event-free probability is much higher for patients with no soft plaques. Graph from Honda, O. et al. (2004). Journal of the American College of Cardiology, 43(7), 1177–1184. link
HeartFlow's Plaque Analysis uses AI to quantify total plaque volume and break it down by type, with over 90% agreement when compared with invasive imaging techniques such as intravascular ultrasound, indicating high accuracy.
This is important as traditional calcium scoring only counts calcified plaque. While calcium score does correlate with heart attack risk over time, it misses soft, non-calcified plaque entirely. Many people who suffer heart attacks had "reassuring" stress tests or only modest calcium scores beforehand, because those tests never saw the dangerous soft plaque.
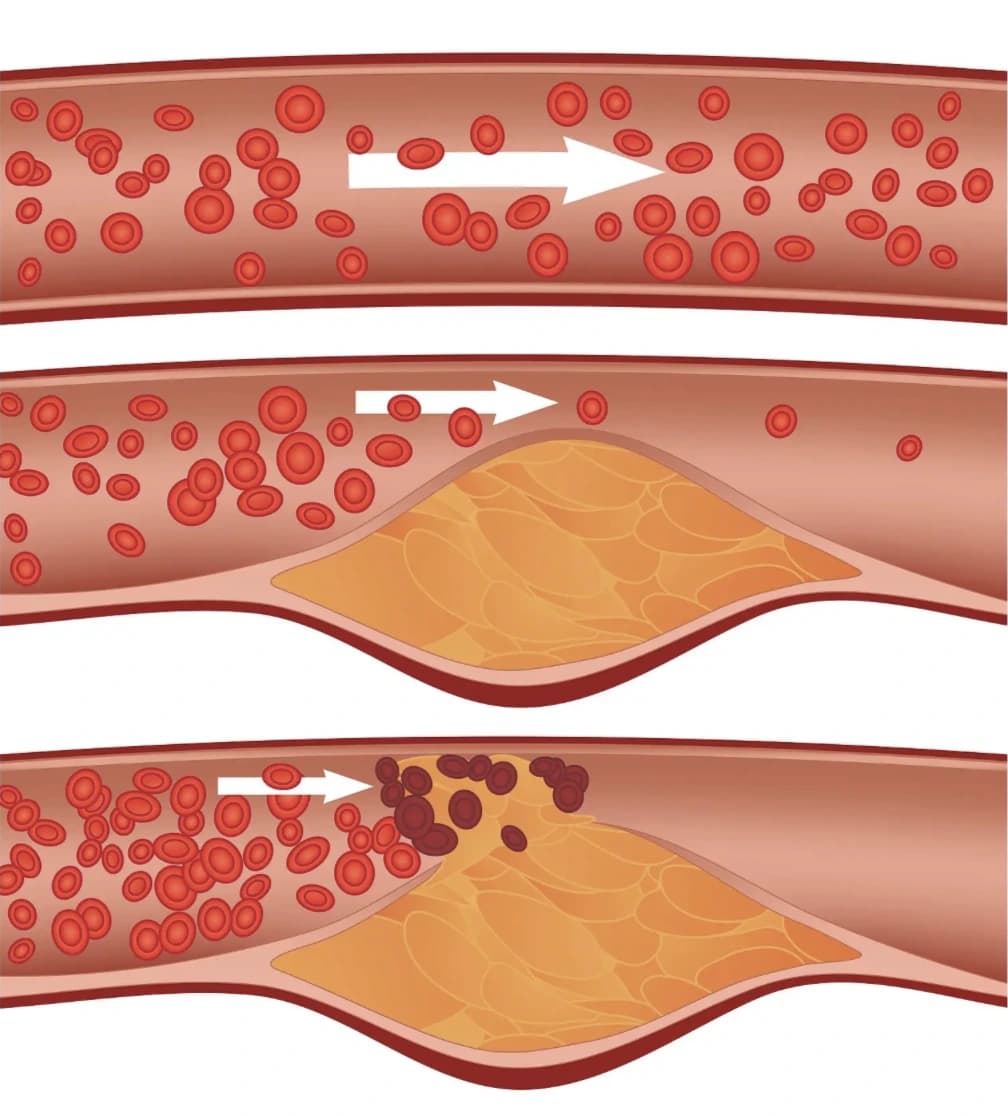
Exhibit 4. Illustration of a ruptured soft plaque leading to a total arterial blockage. Image courtesy of People's Pharmacy
Understanding Your Plaque Burden
HeartFlow quantifies how your plaque volume compares to your peers.
Total Plaque Volume is measured in cubic millimeters (mm³). For context:
- <100 mm³: Minimal plaque burden
- 100–400 mm³: Moderate plaque burden
- 400–750 mm³: High plaque burden
- >750 mm³: Very high plaque burden
Percentile Ranking shows how your plaque burden compares to others your age:
- <25th percentile: Below average for your age
- 25–75th percentile: Average for your age
- >75th percentile: Above average, higher risk
- >90th percentile: Significantly elevated risk
Calcified Plaque Can Increase With Treatment
One of the most confusing things for patients is starting a statin and seeing their calcium or total plaque score actually go up, even as their risk goes down.
The science behind this phenomenon: With effective medical therapy, the body begins to stabilize soft plaque. Over time, soft plaque often becomes more calcified, making it less likely to rupture, which shows up as an increased calcium or total plaque score.
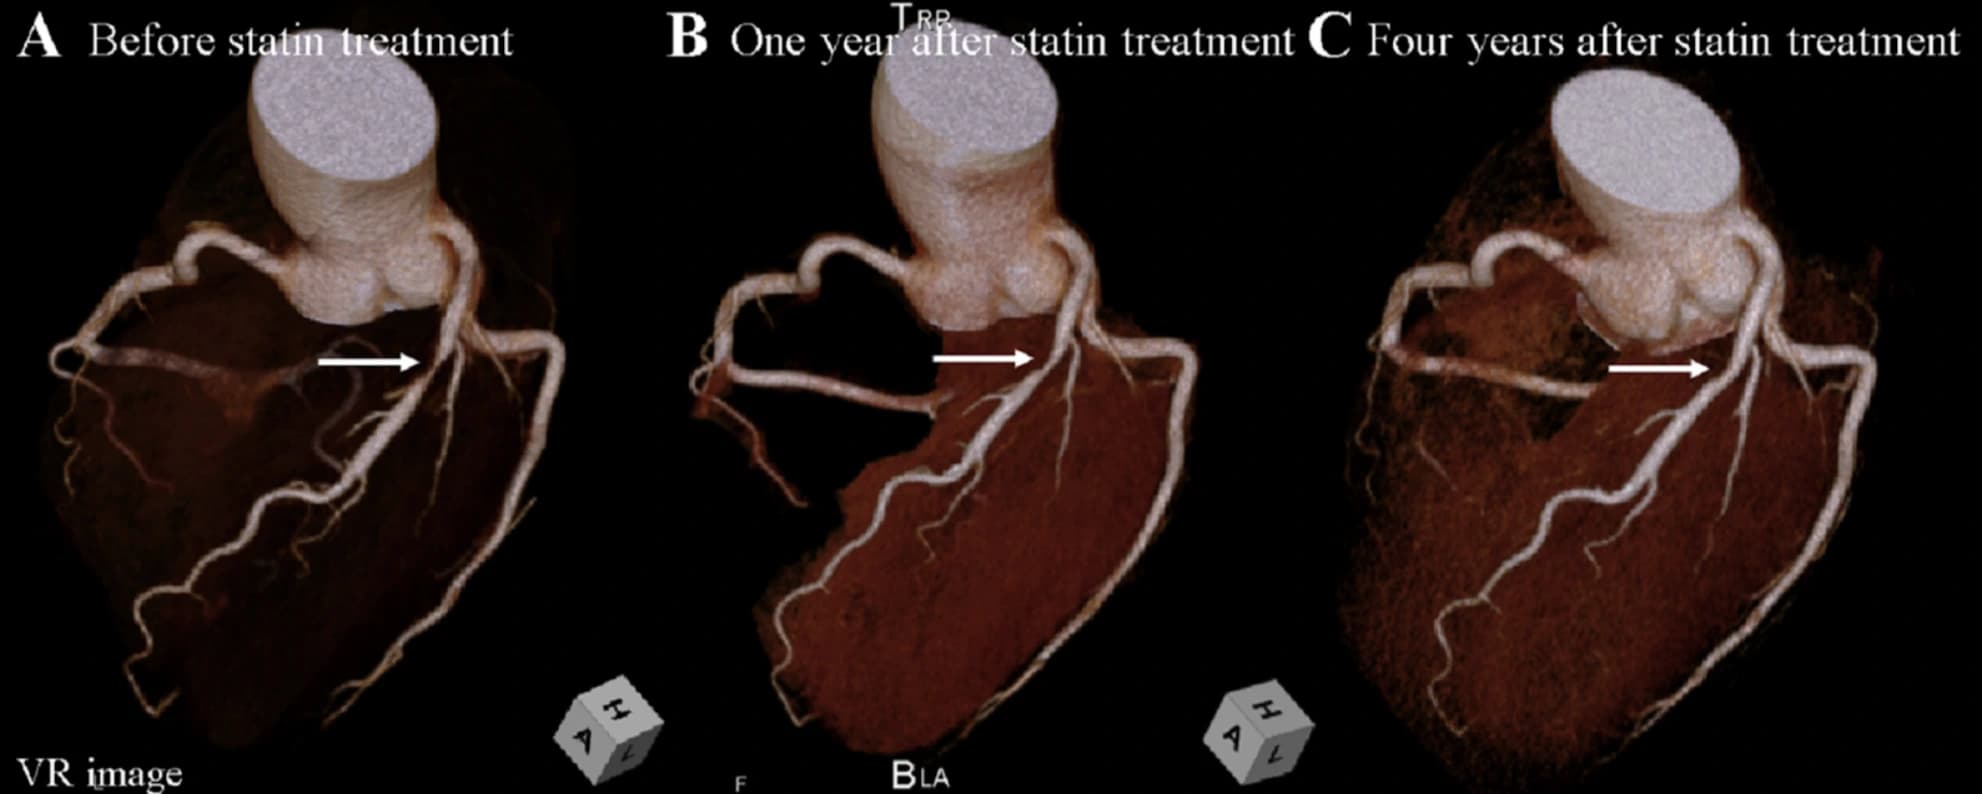
Exhibit 5. A "before and after" of plaque composition with lifestyle and medication. Image source: A case of prominent coronary plaque regression with statin therapy — Awaya, Toru et al. Journal of Cardiovascular Computed Tomography, Volume 14, Issue 3, 275–276
This is actually good news. The goal of medical management and lifestyle change is to reduce dangerous soft plaque and/or convert it into more stable calcified plaque, while keeping overall burden from progressing.
This is why sequential CCTA imaging is so valuable: it shows not just total plaque volume, but composition changes over time.
What to Expect at TrueScan: The Complete CCTA Experience
At TrueScan, we've designed the CCTA with HeartFlow AI experience to be comprehensive, convenient, and patient-centered.
Before Your Scan
Preparation:
- Your doctor will need to send us an order form (Download here)
- Fast for 4 hours before your appointment (water is fine)
- Avoid caffeine for 12 hours (it can increase heart rate)
- Complete intake forms through the TrueScan patient portal
- For the clearest images, we need your heart rate below 60bpm. Your physician will likely prescribe a beta blocker to lower your heart rate before arriving for your scan.
During Your Scan
When You Arrive:
- Check in 15 minutes early
- We'll check your heart rate and blood pressure
The Scan:
- Small IV placed for contrast dye
- EKG stickers attached to monitor your heart
- Lie comfortably on the CT scanner
- Contrast injection (you'll feel warmth, which is totally normal)
- Hold your breath briefly a few times
- Actual scan time: Less than 5 minutes
After Your Scan
Within 7 days, you'll receive your complete cardiology report and HeartFlow analysis. A 1:1 video consultation with one of our TrueScan physicians is included to review your results (Meet our medical team).
Pricing
TrueScan CCTA with HeartFlow AI: $1,295
Includes:
- Complete cardiac CT angiography
- HeartFlow FFR-CT Analysis
- HeartFlow Plaque Analysis
- HeartFlow RoadMap Analysis
- Comprehensive written cardiology report
- 1:1 physician consultation
TrueScan Total Health (Full-Body MRI + CCTA) Package: $2,995
Our Full-Body MRI is a 60-minute scan from brain to ankle that screens for 500+ conditions including cancers, aneurysms, autoimmune diseases, and musculoskeletal issues. However, it doesn't visualize the coronary arteries, which is where CCTA with HeartFlow AI comes in. Together, they provide a comprehensive picture of your health, which is why many patients choose to do both scans in a single visit. Includes a 1:1 physician consultation as well.
Bringing It All Together
Heart disease remains the leading cause of death, but the tools for understanding and managing risk have evolved dramatically.
CCTA combined with HeartFlow AI lets us:
- See plaque in unprecedented detail, including soft and low-attenuation plaque.
- Understand how that plaque is affecting blood flow, vessel by vessel.
- Tailor treatment and lifestyle recommendations, then track changes over time.
For many patients, this means discovering and treating high-risk plaque before it causes symptoms or a heart attack. For clinicians, it means moving from guesswork to data-driven, personalized care.
Who Should Consider a CCTA with HeartFlow AI?
You may want to discuss this type of scan with your doctor if you:
- Have a family history of heart disease
- Have risk factors like high cholesterol, high blood pressure, diabetes, or metabolic syndrome
- Have an elevated calcium score and want a more complete picture of soft plaque
- Have concerning but inconclusive stress test results
- Are on statin therapy and want to track treatment response over time
- Simply want a proactive, detailed assessment of your coronary risk
Take the Next Step
TrueScan's team works closely with referring physicians and cardiologists to integrate CCTA + HeartFlow findings into your overall care plan.
Ready to see your heart in 3D?
- Phone: 727-256-0095
- Email: hello@truescanmri.com
- Learn more: truescanmri.com/discover-ccta
For Physicians: If you have patients who would benefit from CCTA with HeartFlow AI, we offer rapid turnaround of results for referring providers. Contact us at hello@truescanmri.com to discuss partnership opportunities.
Further Readings:
Plaque imaging with CT: a comprehensive review on coronary CT angiography based risk assessment -read here
Coronary Atherosclerotic Plaque Burden Assessment by Computed Tomography and Its Clinical Implications -read here
References
[1] Honda, O., Sugiyama, S., Kugiyama, K., et al. (2004). Echolucent carotid plaques predict future coronary events in patients with coronary artery disease. Journal of the American College of Cardiology, 43(7), 1177–1184. link
[2] Cao, J. J., Shen, L., Nguyen, J., et al. (2023). Accuracy and limitation of plaque detection by coronary CTA: a section-to-section comparison with optical coherence tomography. Scientific Reports, 13(1), 11845. link
[3] FFRCT analysis. (n.d.). HeartFlow. link
[4] Vatsa, N., Faaborg-Andersen, C., Dong, T., Blaha, M. J., Shaw, L. J., & Quintana, R. A. (2024). Coronary Atherosclerotic Plaque Burden Assessment by Computed Tomography and Its Clinical Implications. Circulation: Cardiovascular Imaging, 17(8), e016443. link